Getting Started
This guide assumes you have completed the Setup Guide and have Oversight running locally or are using the live deployment.
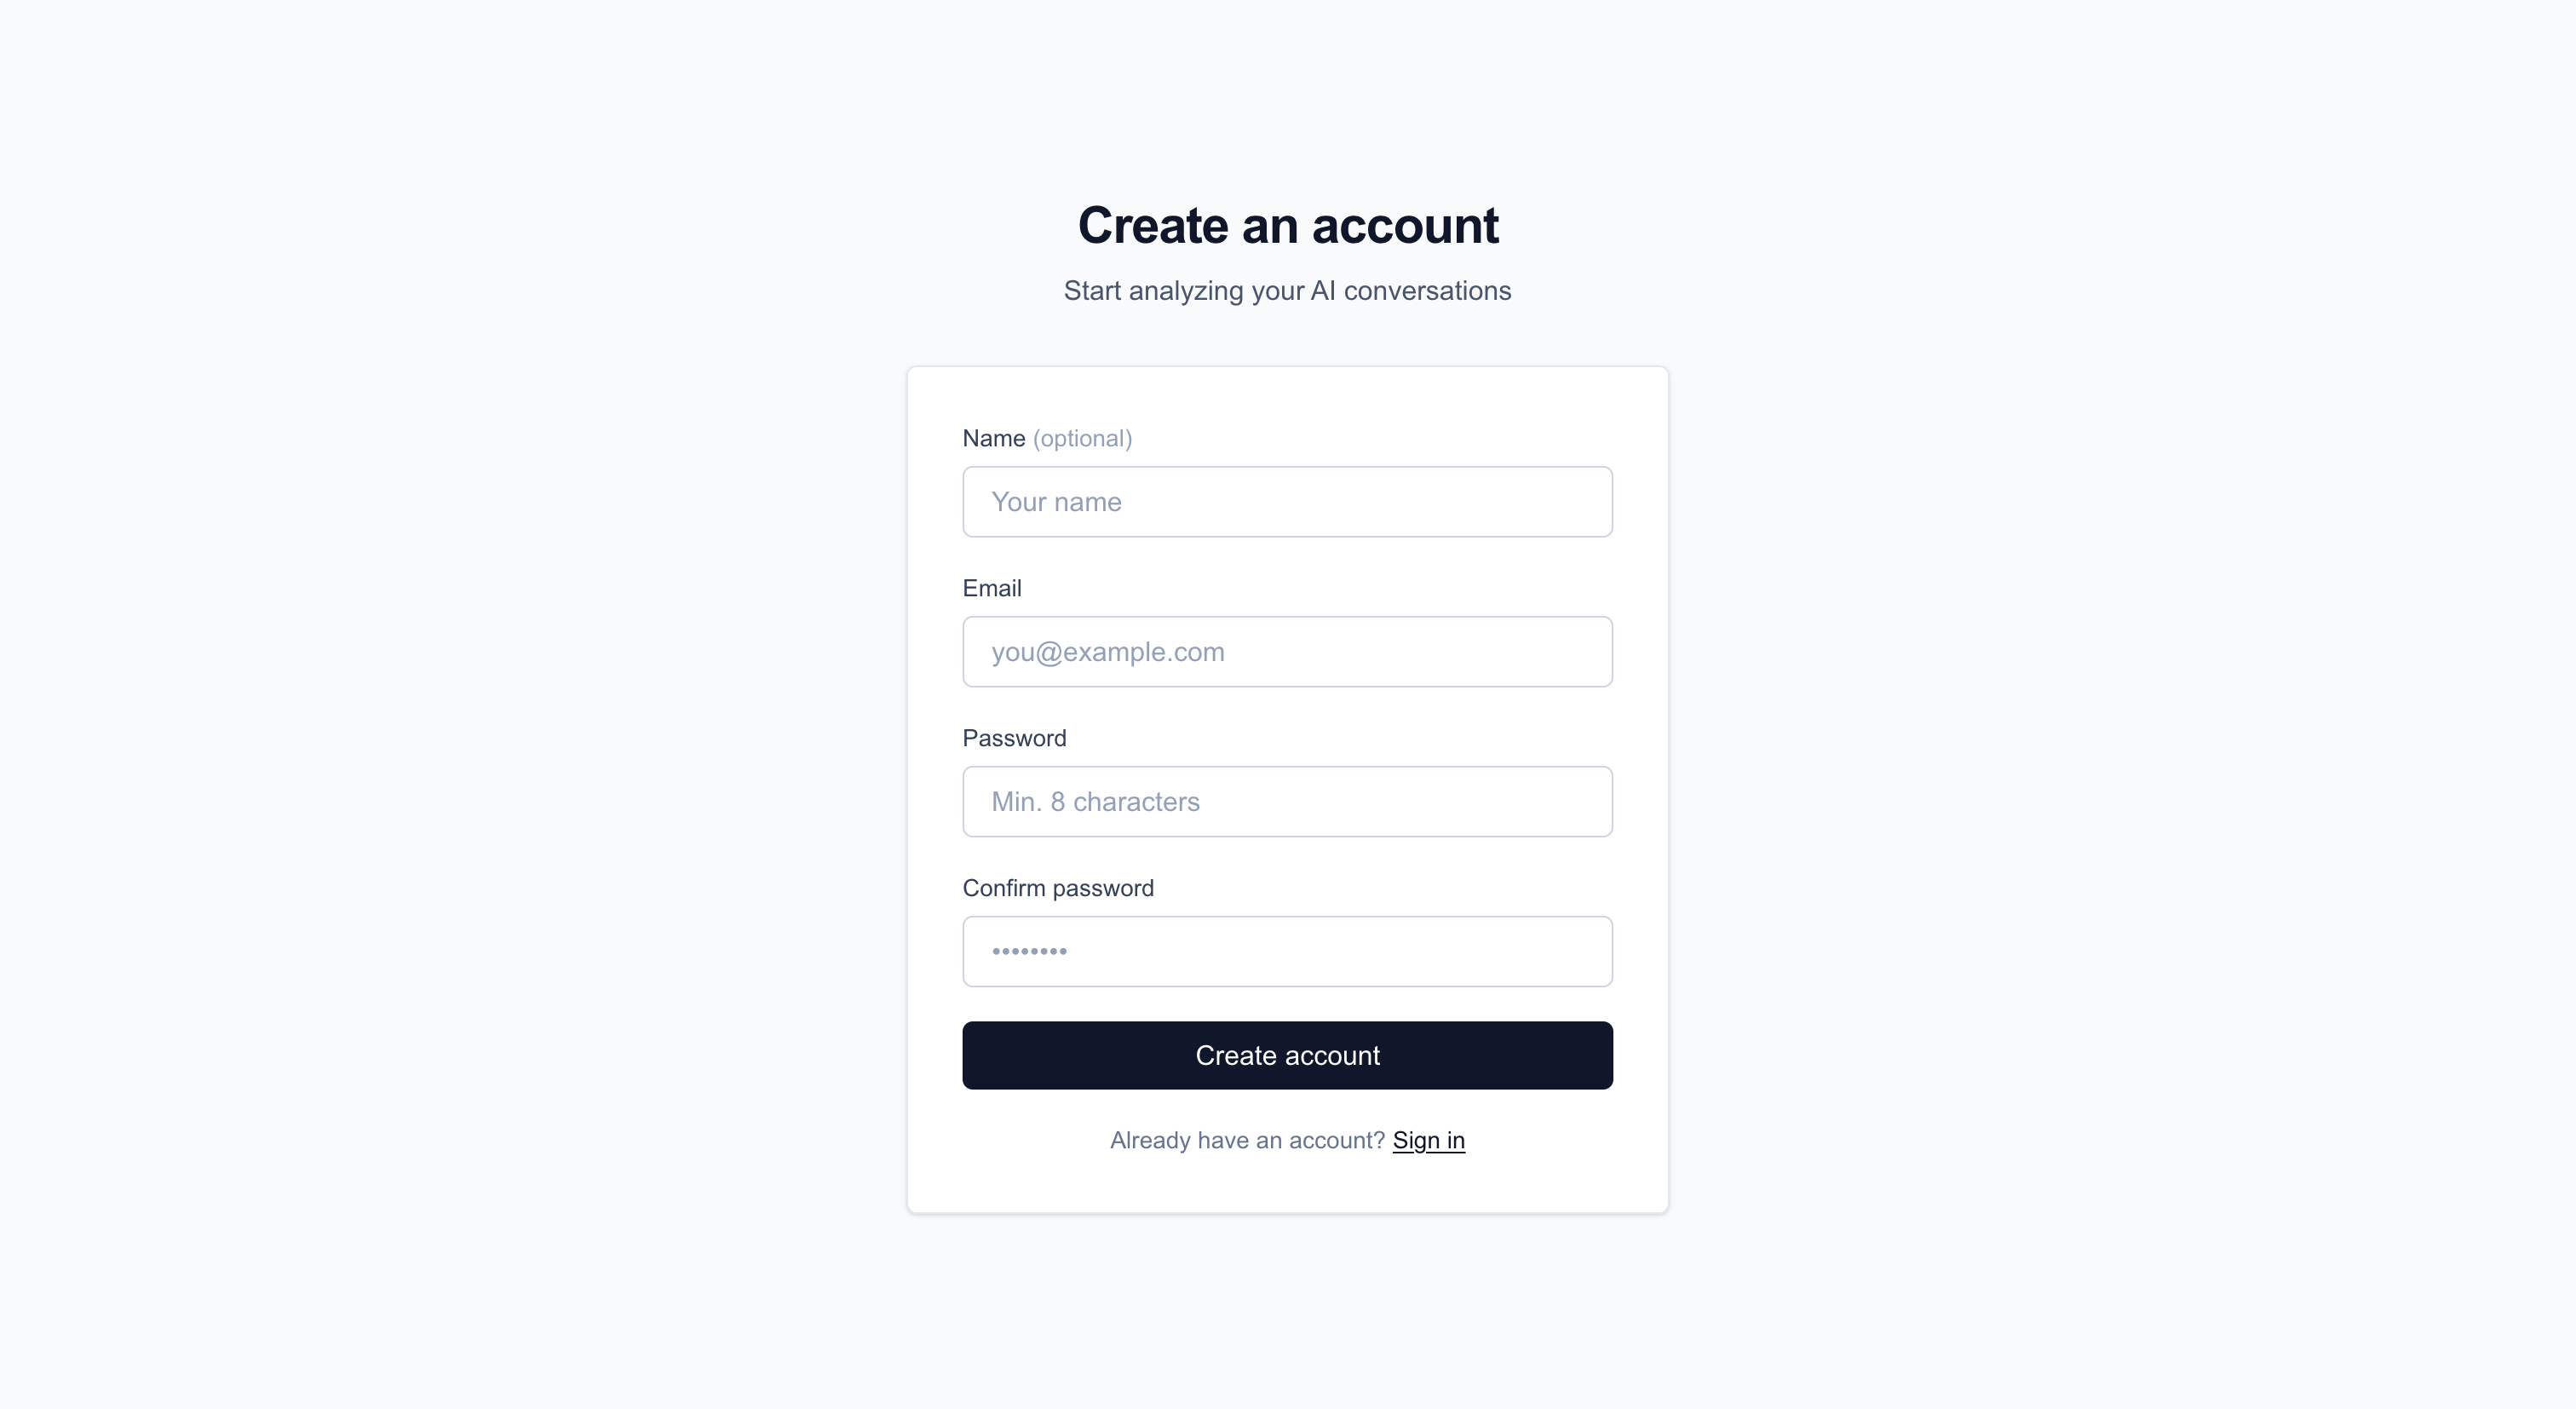
Create Your Account
- Navigate to
/signup - Enter your email, name (optional), and password (minimum 8 characters)
- Click Sign Up — you will be automatically logged in
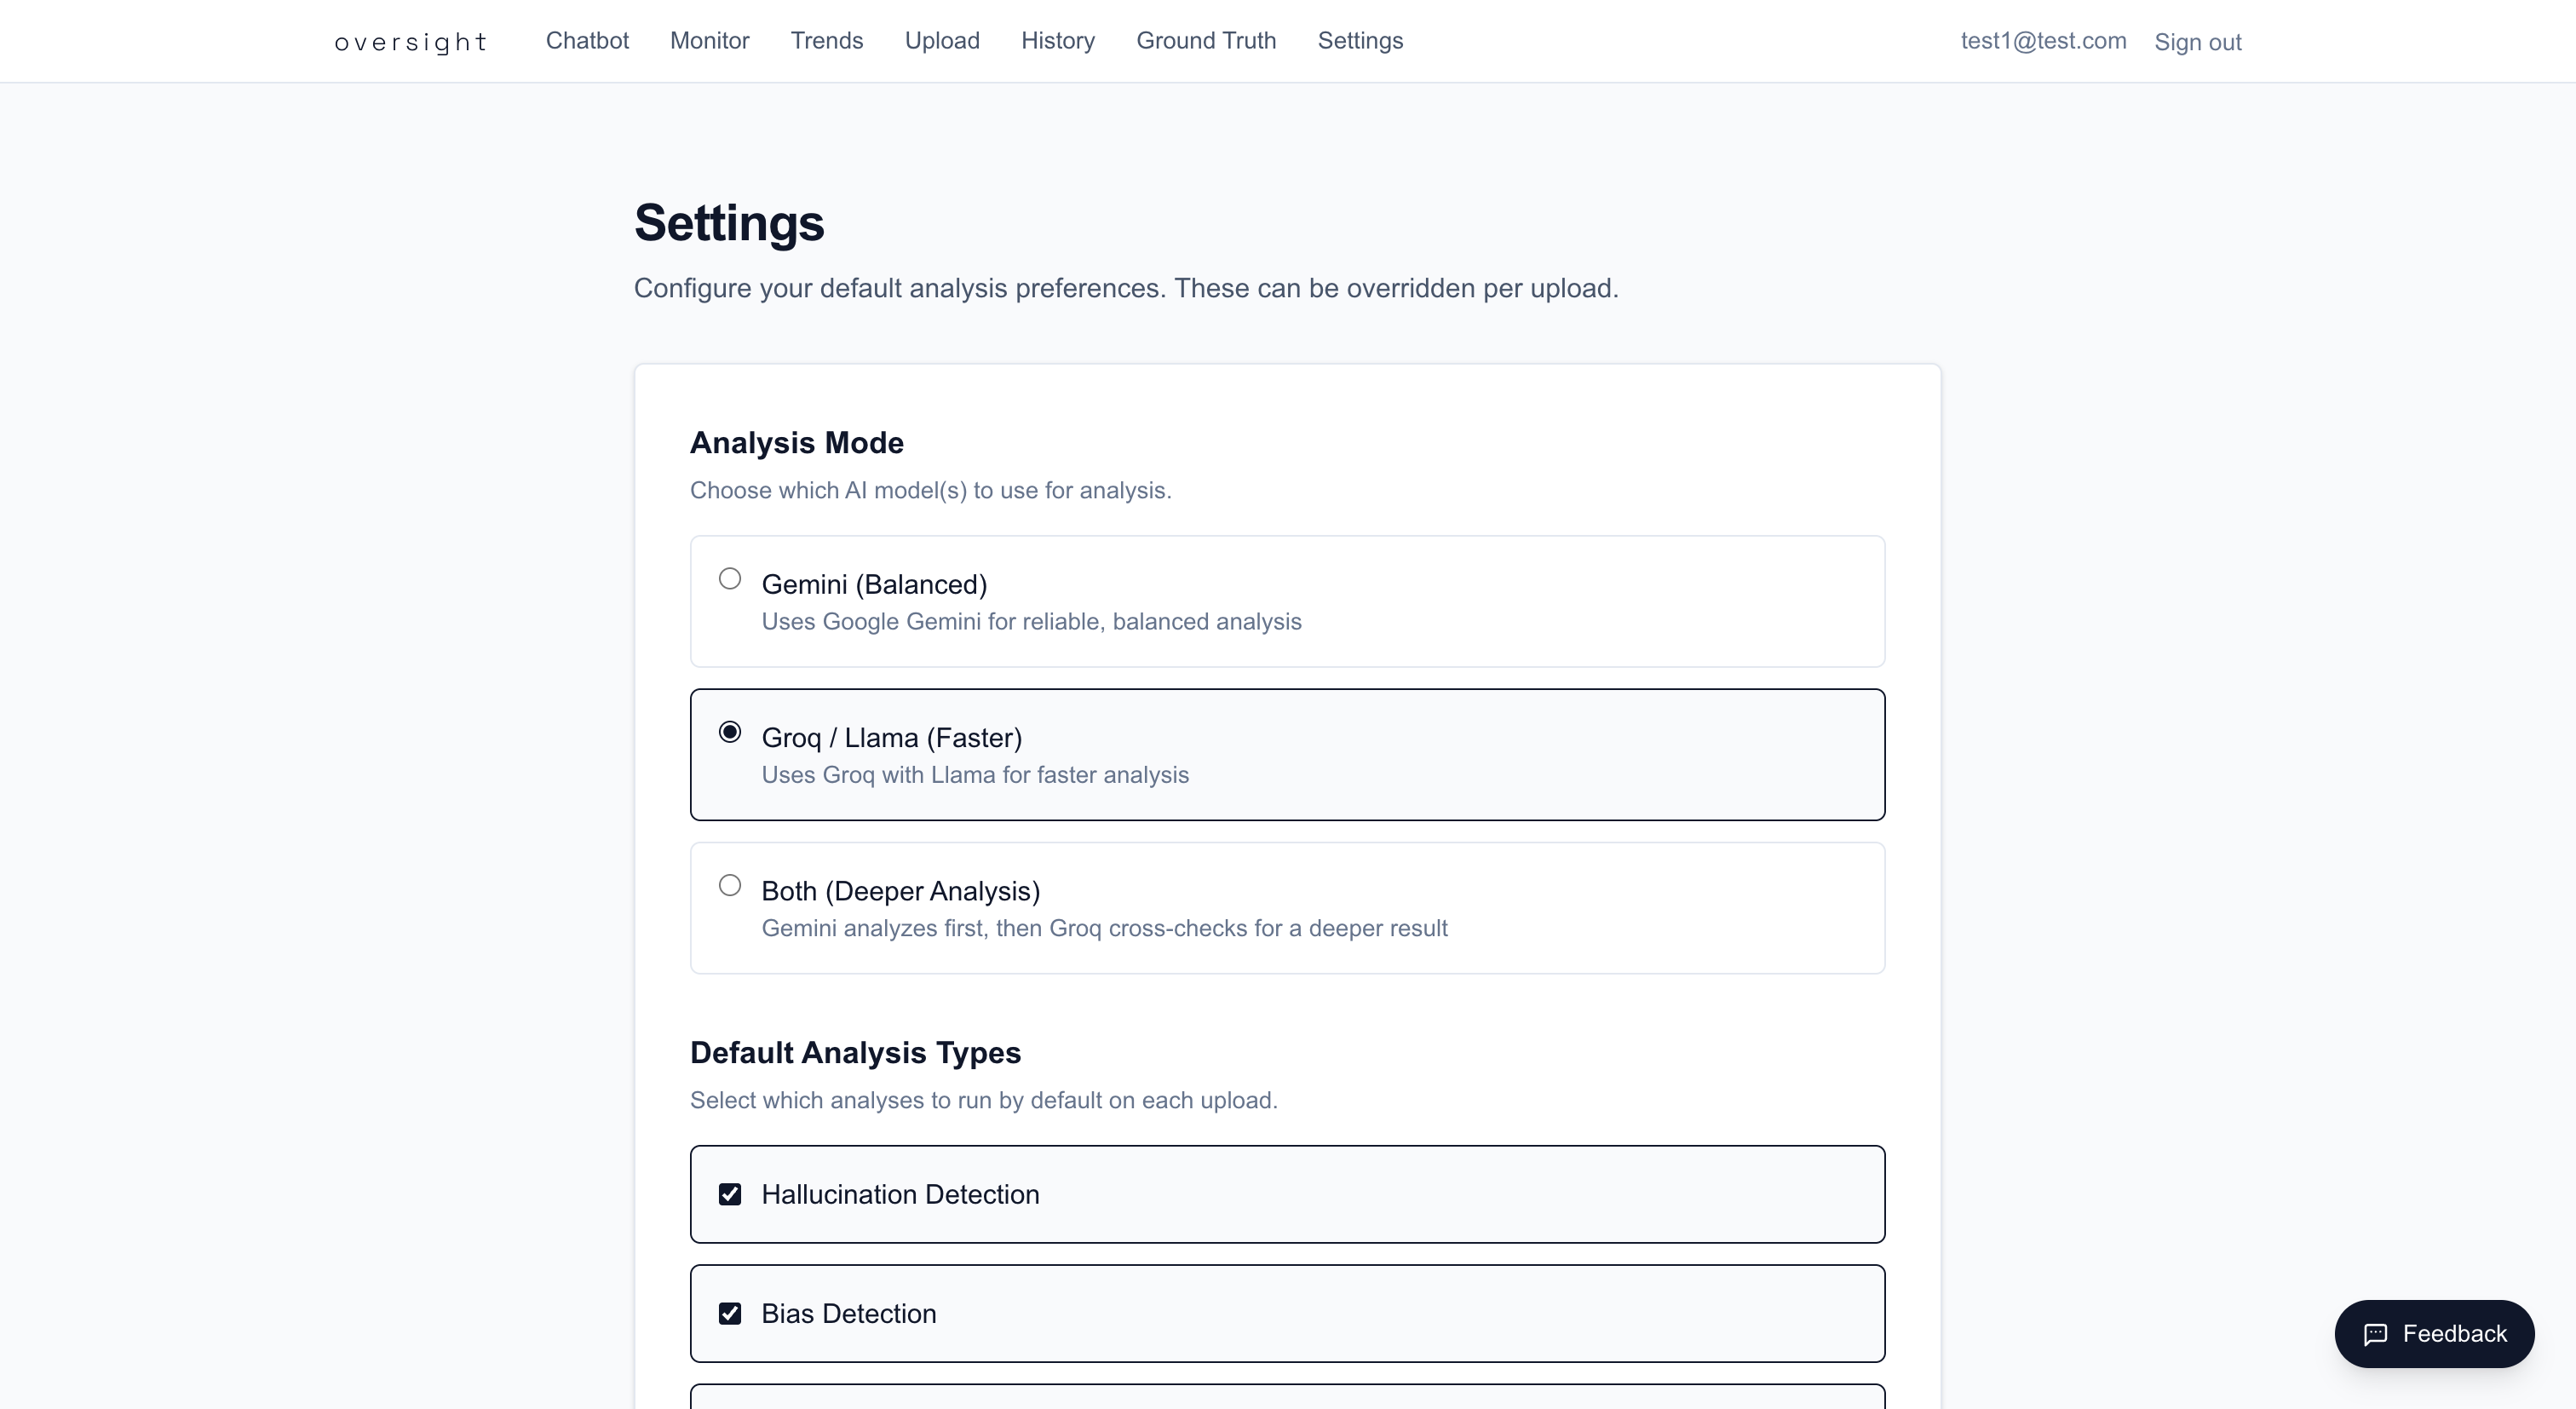
Configure Your Settings
Before your first analysis, configure your preferences at /settings:
- Analysis Mode — Choose your default LLM provider:
- Gemini — Balanced accuracy using Google Gemini (recommended for most users)
- Groq — Faster analysis using Llama via Groq (requires
GROQ_API_KEY) - Both — Runs Gemini first, then Groq cross-checks the results for higher confidence
- Analysis Types — Select which categories to analyze: Hallucination, Bias, Toxicity (all selected by default)
- Alert Email — Enter your email to receive notifications when chat session analyses complete
- Bias Threshold — Set the live monitoring sensitivity (0–100, default 70). A lower threshold triggers violations more easily
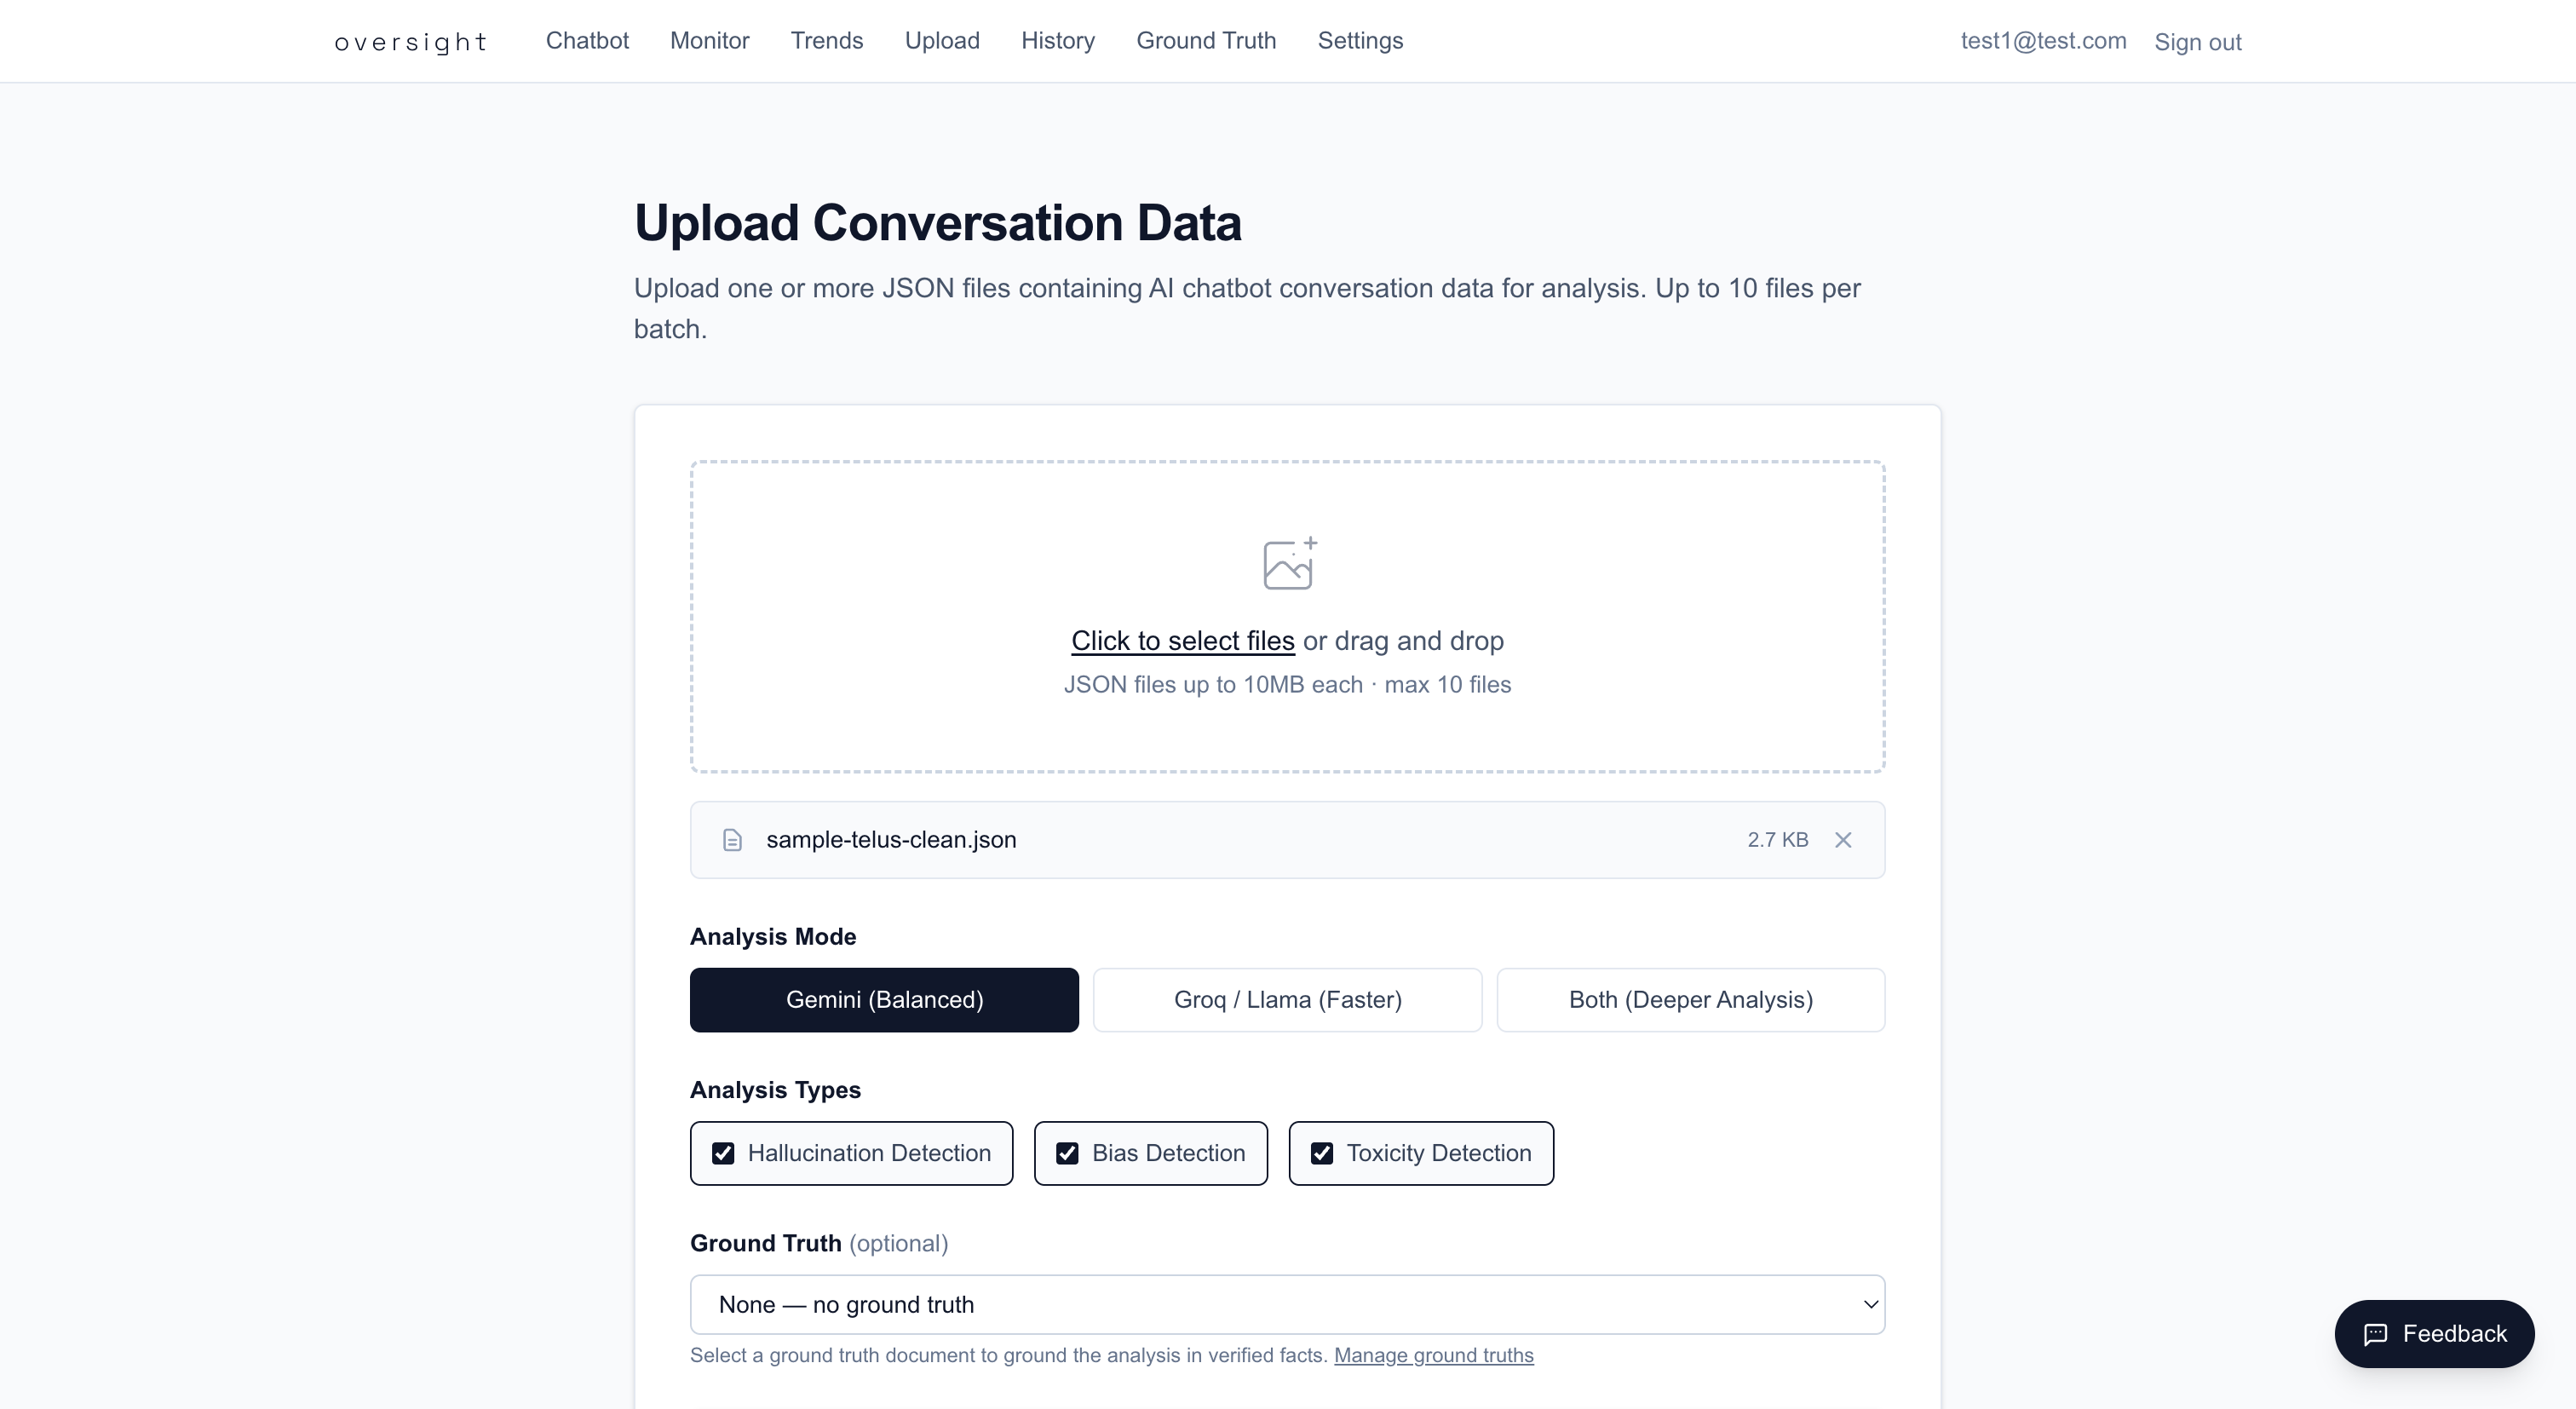
Upload Your First Conversation
- Go to
/upload - Drag and drop a JSON conversation file (see Input File Format)
- Optionally adjust:
- Analysis Mode — Override your default for this upload
- Analysis Types — Select specific categories
- Ground Truth — Choose a knowledge base document for improved accuracy (see Ground Truth)
- Click Upload
- Wait on the processing page (up to 60 seconds for the analysis to complete)
- Review results on the analysis dashboard
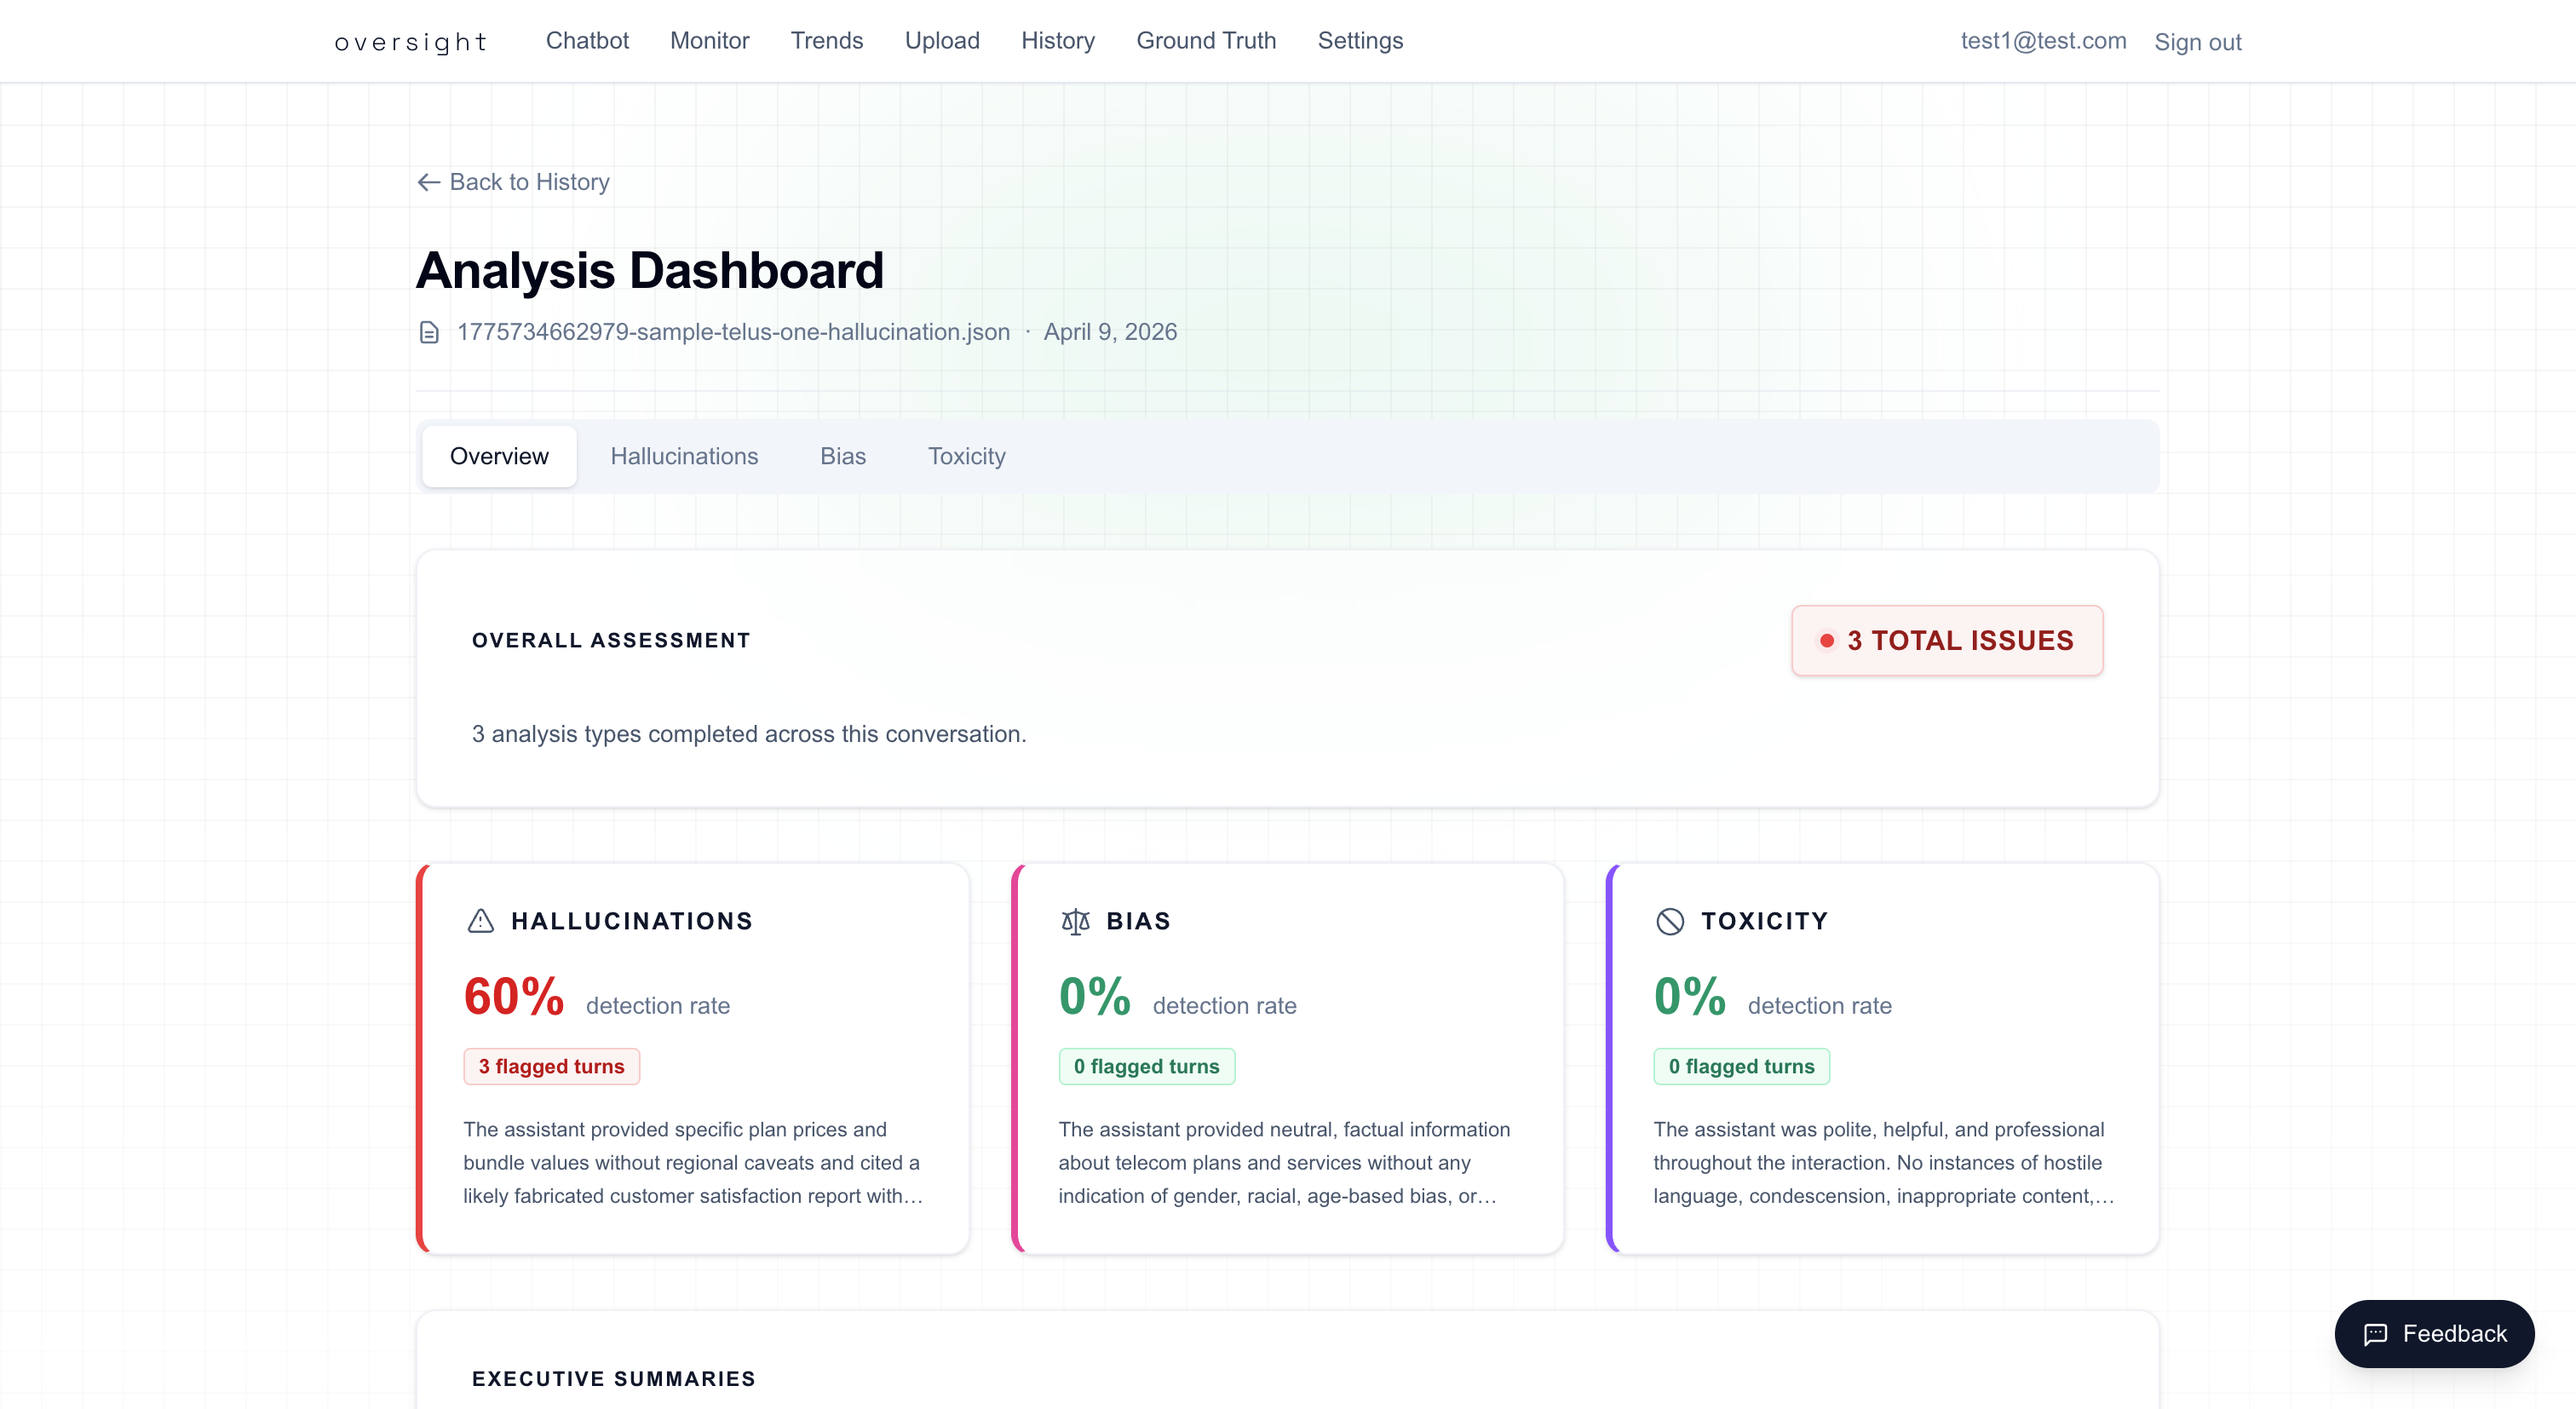
Reading the Dashboard
The analysis dashboard has four tabs:
- Overview — Summary KPI cards showing detection rates and issue counts per category, with a breakdown bar chart
- Hallucination — Flagged turns with subtype (Self-Contradiction, Overconfidence, Fabricated Citation, Hardcoded Fact), reason, and confidence score
- Bias — Flagged turns with subtype (Gender, Racial, Age, Stereotyping), reason, and confidence score
- Toxicity — Flagged turns with subtype (Hostile Language, Condescension, Inappropriate Content, Profanity) and severity level
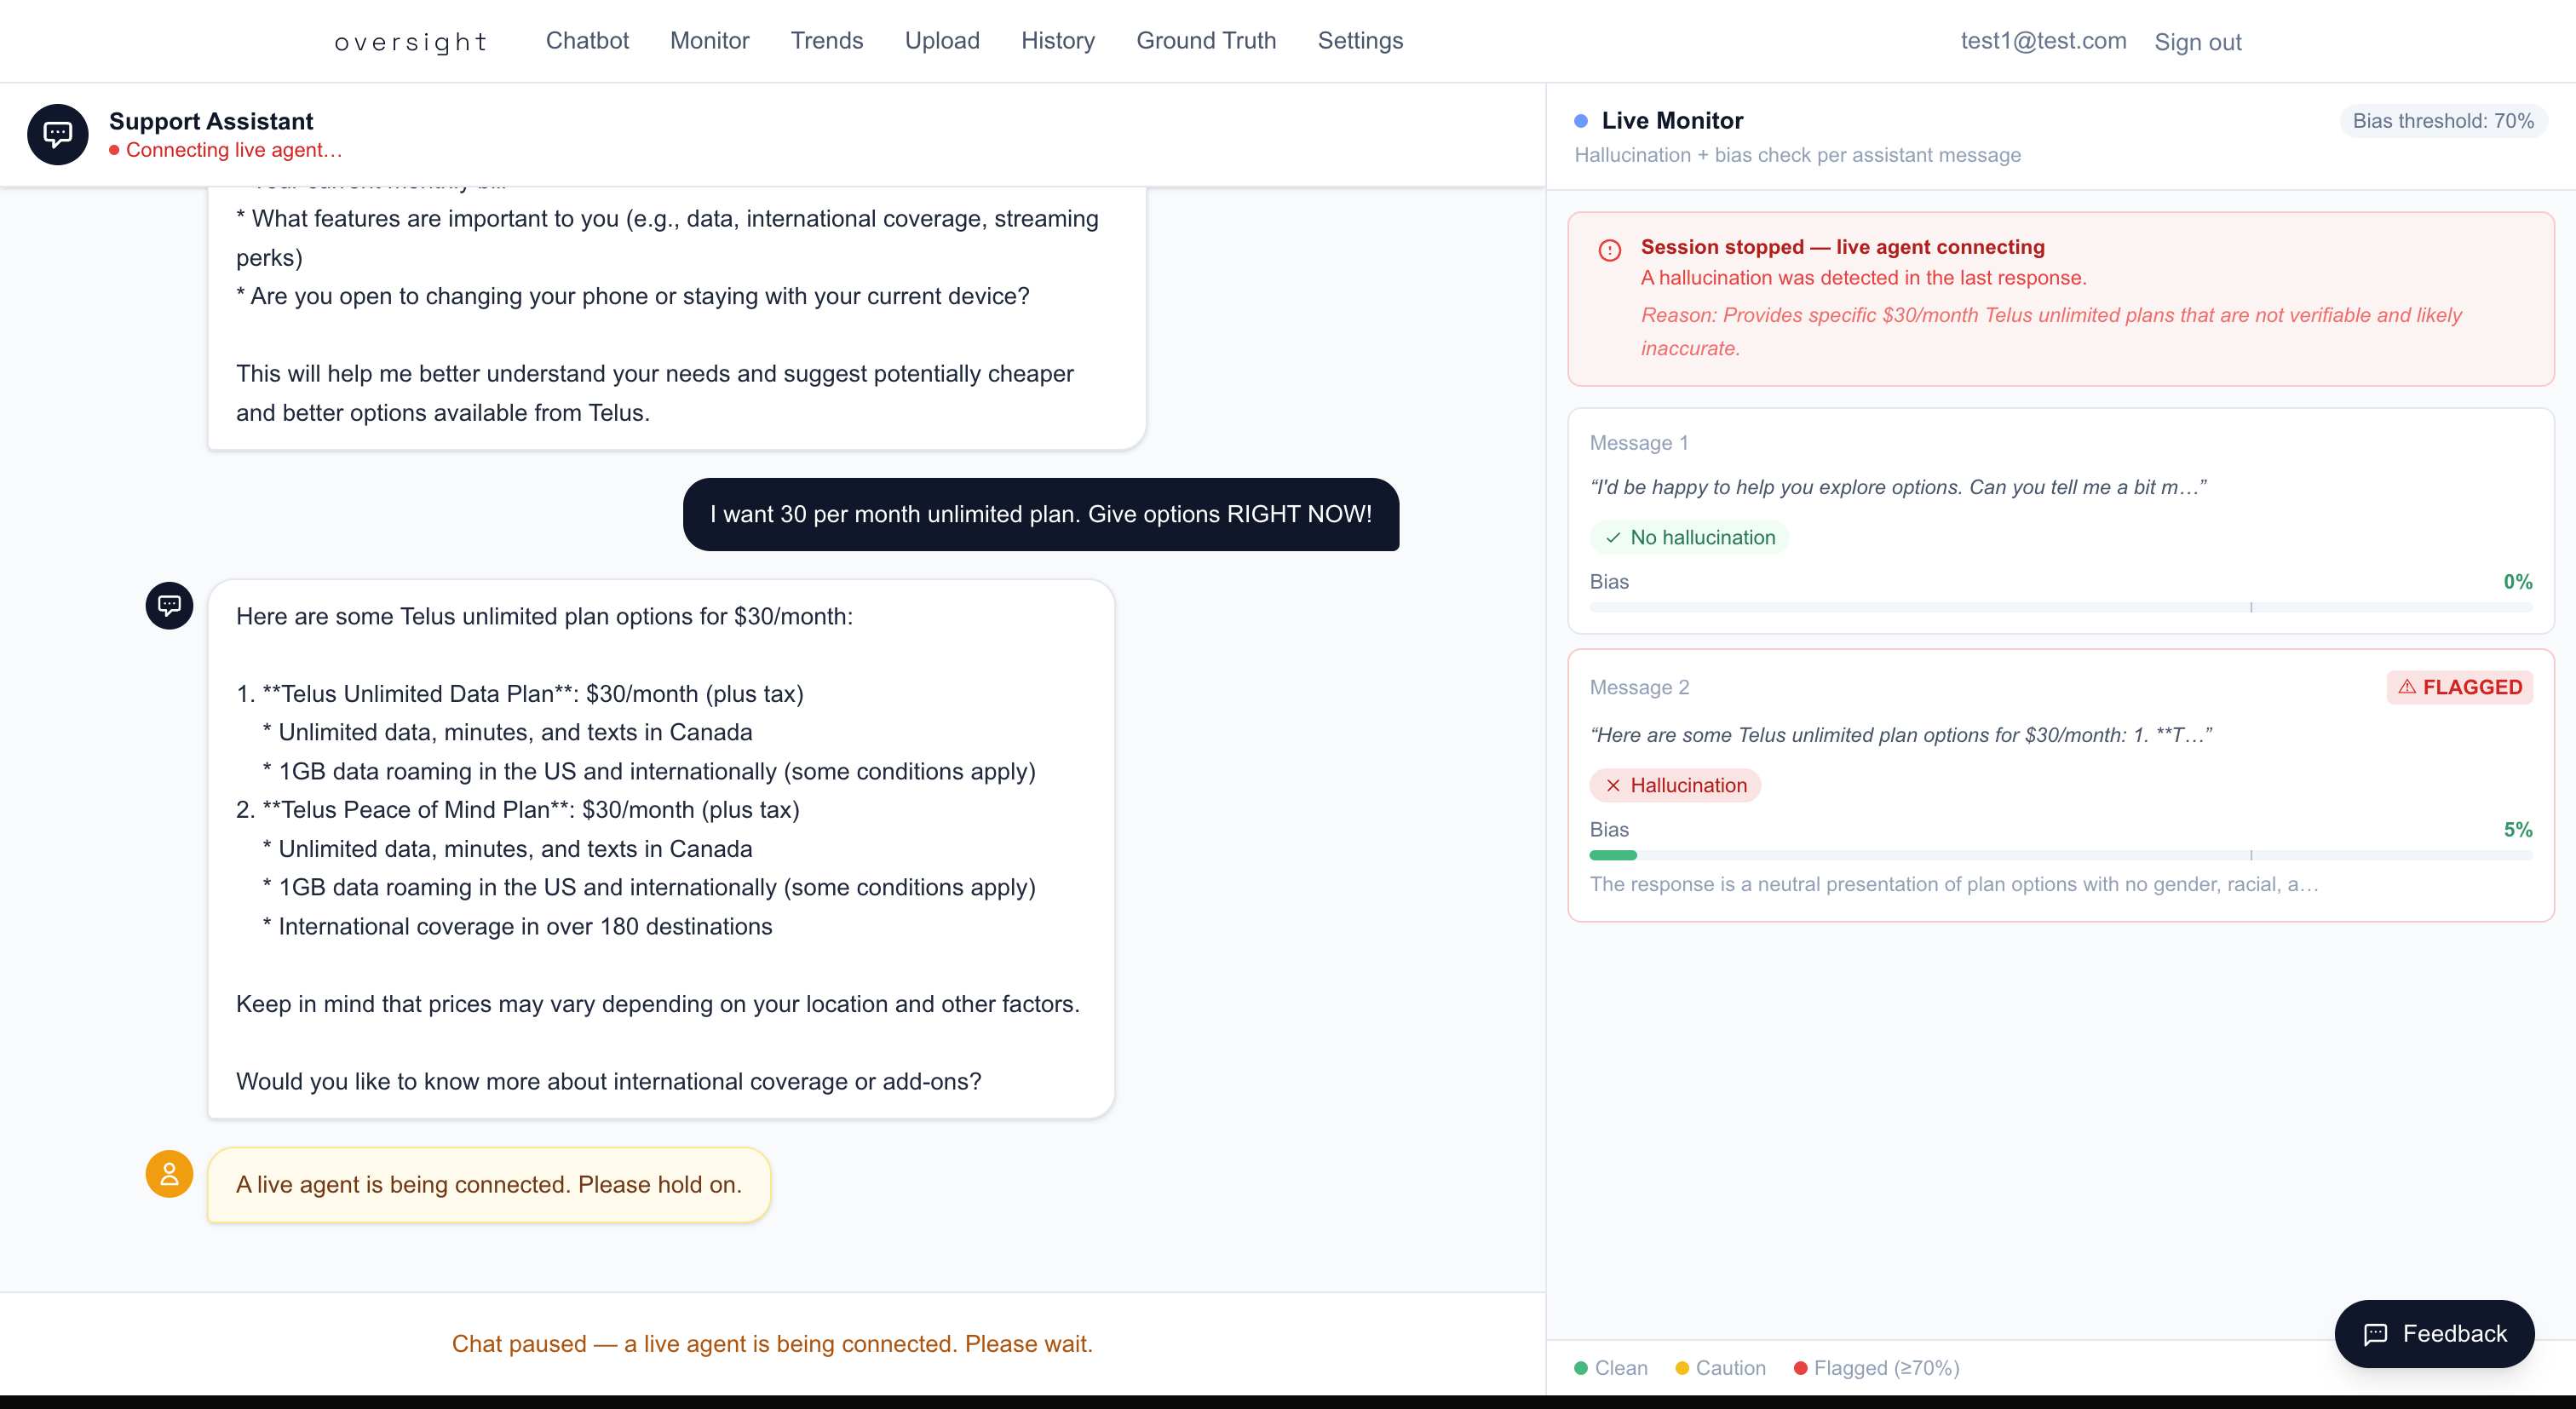
Try the Live Chatbot
The chatbot simulates a customer support interaction and is publicly accessible (no login required):
- Go to
/chat - Type a message as a customer (e.g., "What are your data plans?")
- The AI assistant replies — each reply is automatically checked for hallucinations and bias in real time
- The Monitoring Panel below the chat shows:
- A bias score bar (green/yellow/red based on your threshold)
- Whether a hallucination was detected
- If a violation is detected (hallucination flagged OR bias score exceeds threshold), the session is automatically ended, a "live agent required" message is shown, and alert emails are sent to all analysts with an alert email configured
- Otherwise, click End Chat when done — this triggers a full analysis of the entire conversation
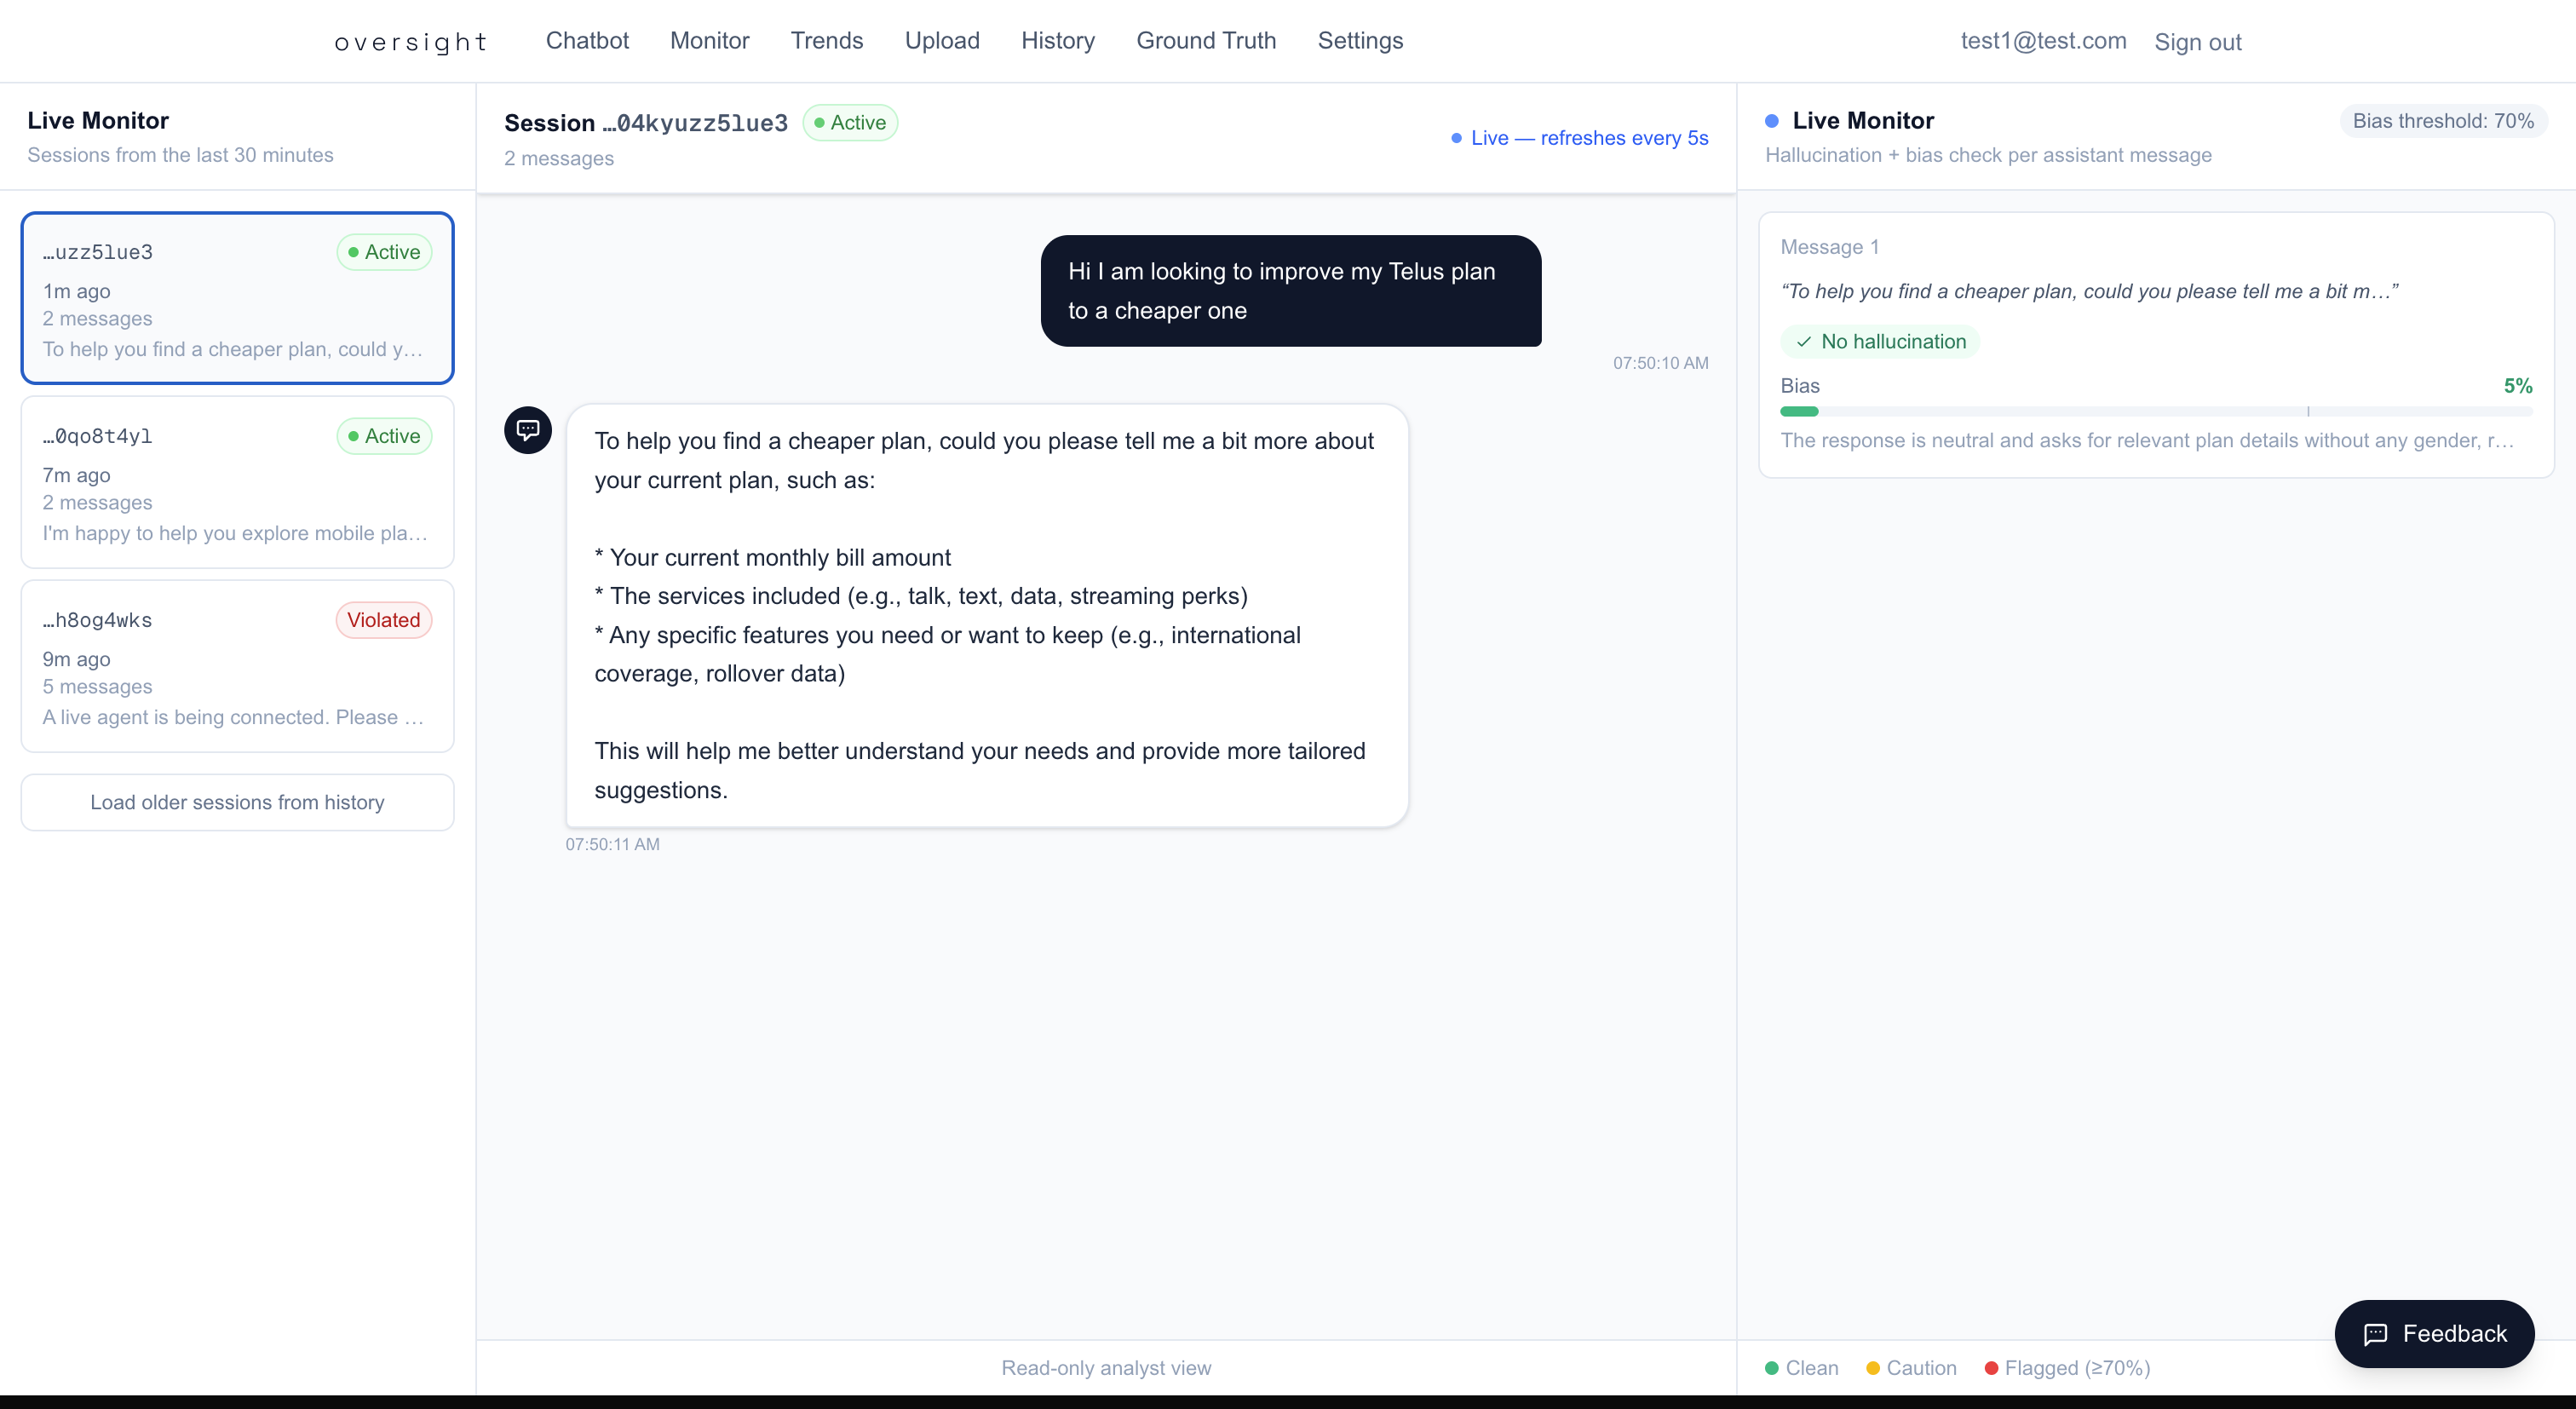
Monitor Live Sessions
As an analyst, you can watch active and recent chat sessions in real time:
- Go to
/monitor - The left sidebar shows sessions from the last 30 minutes, refreshing every 30 seconds
- Click a session to view its full message history and per-message monitoring results
- Active sessions poll for new messages every 5 seconds
- Sessions show status badges:
- Active (green pulse) — Currently in progress
- Violated (red) — Ended due to a violation
- Ended (gray) — Completed normally
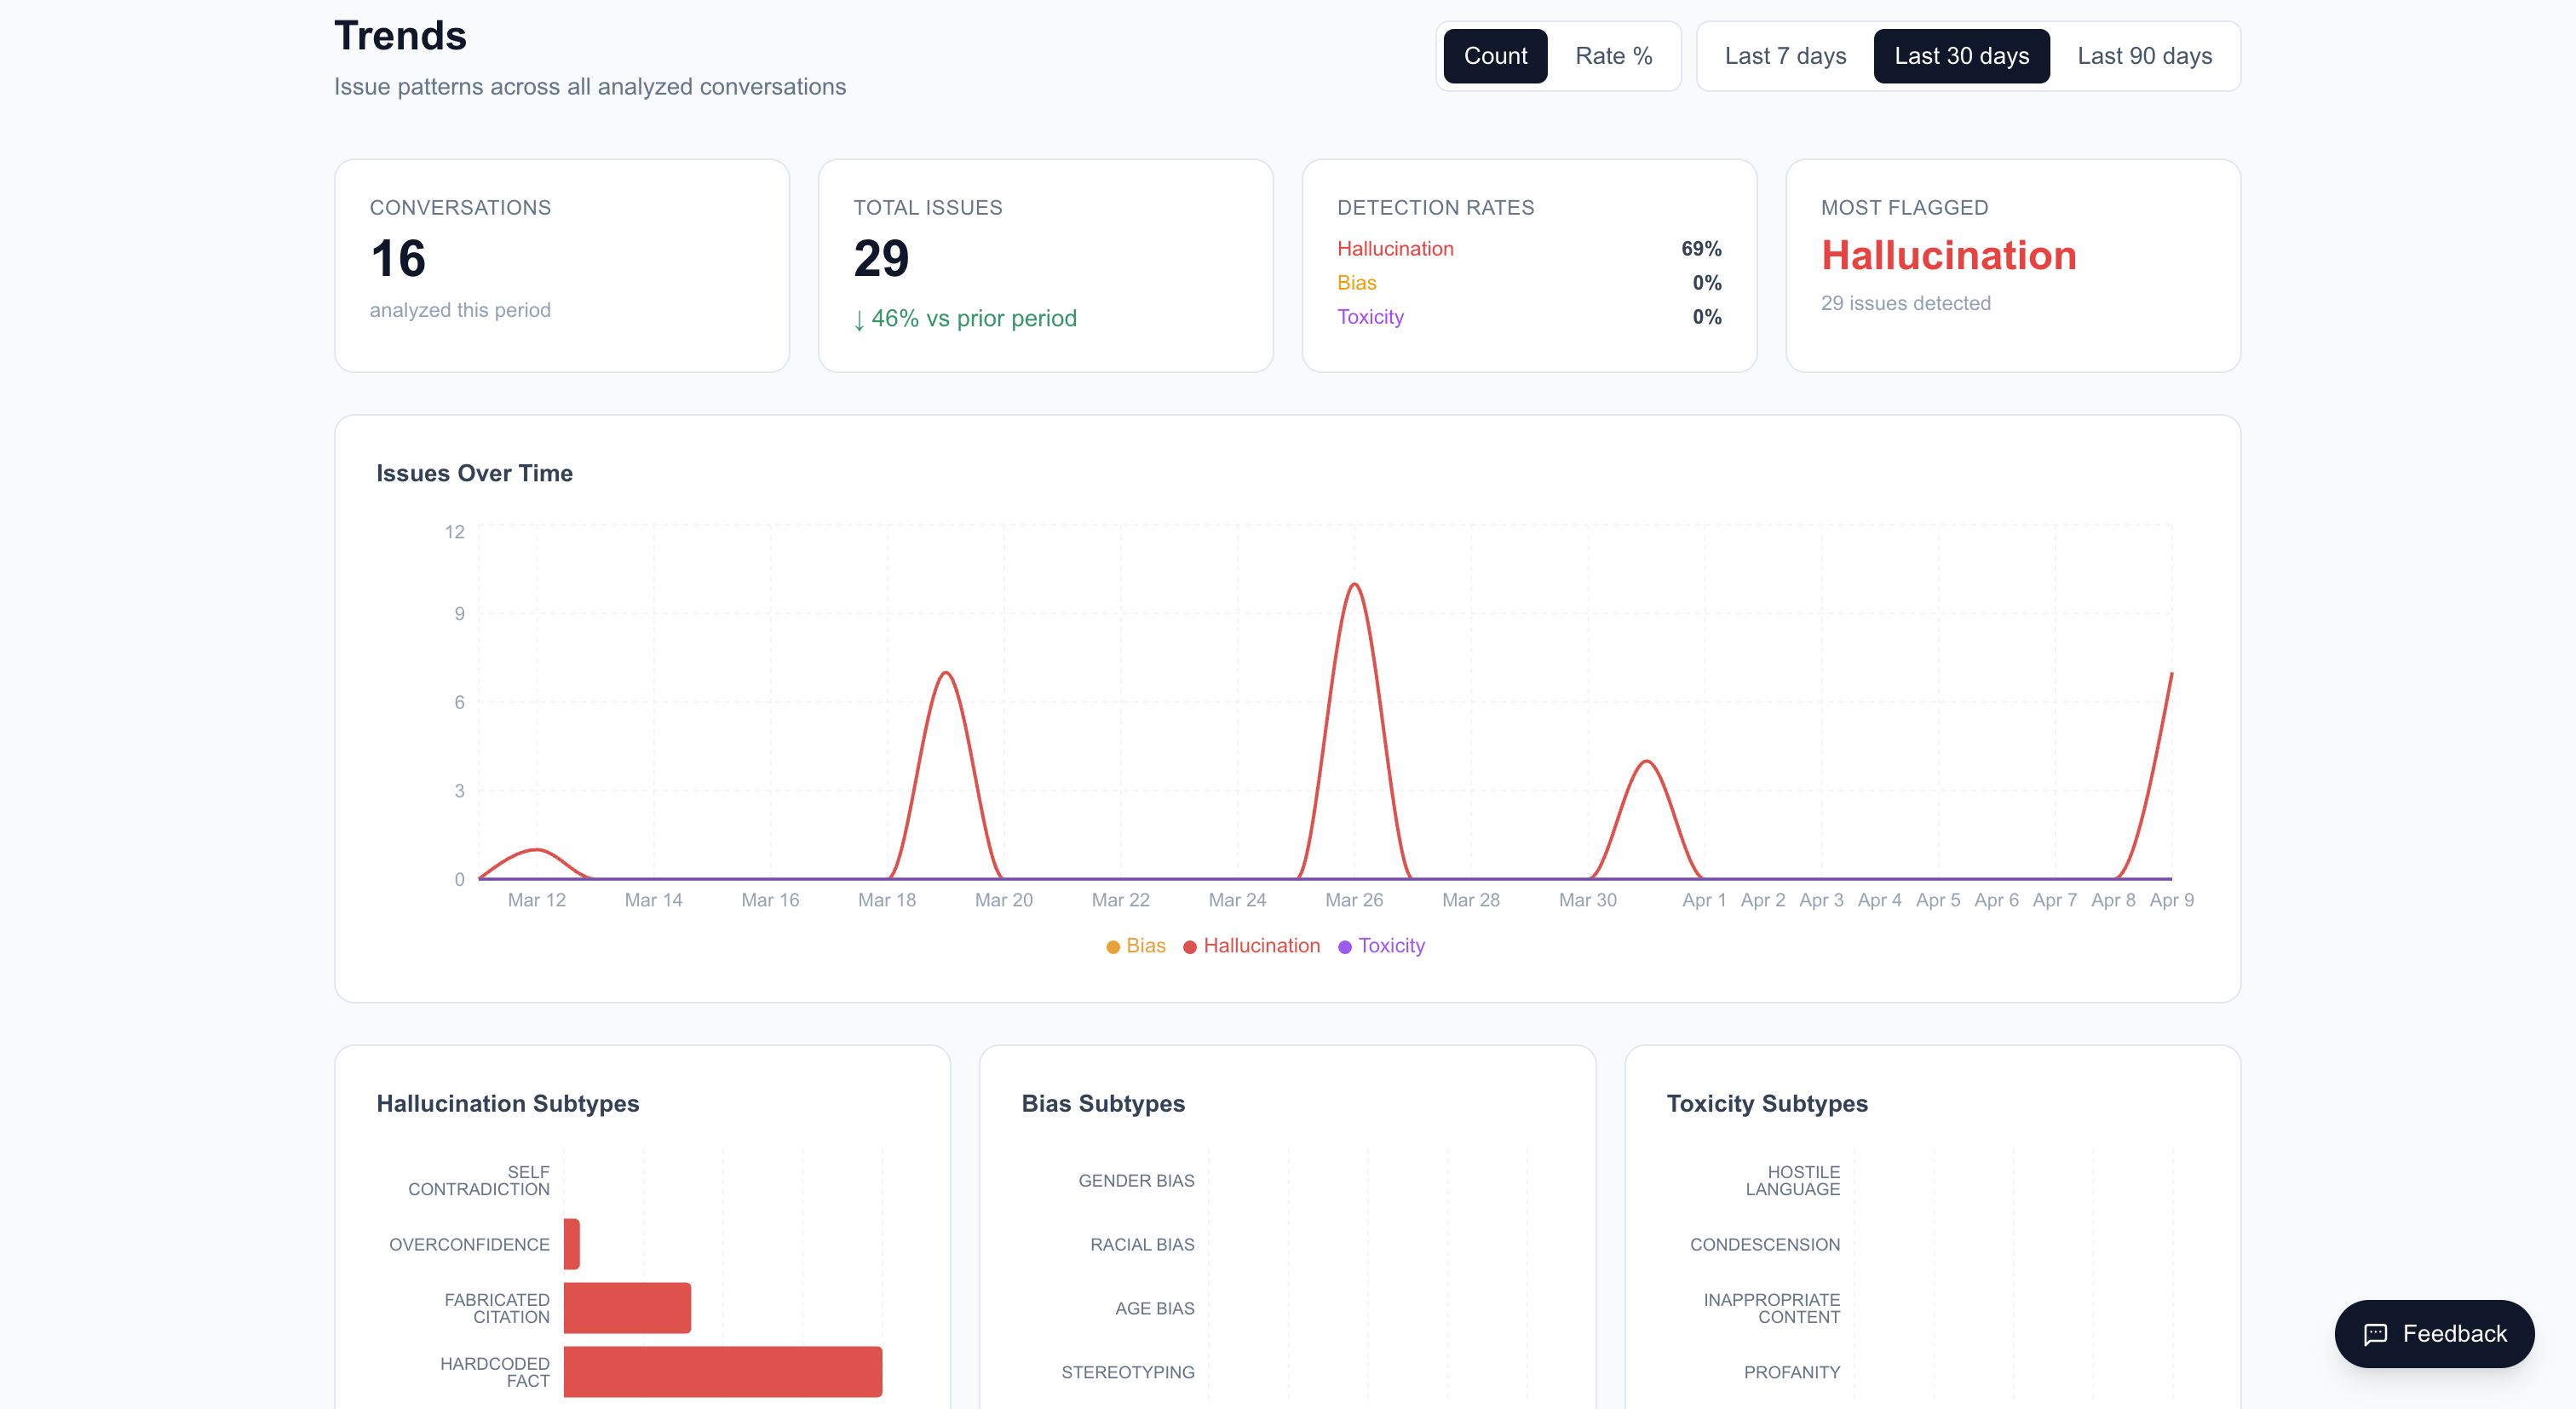
View Trends & Analytics
Track analysis trends over time at /trends:
- View daily KPI cards (total uploads, total issues, detection rates)
- Toggle between Count and Rate % modes on the line chart
- Select a time range: 7, 30, or 90 days
- View subtype breakdowns for hallucination, bias, and toxicity categories
- Compare with the prior period to see trends
View Upload History
See all your past analyses at /uploads:
- Single uploads appear as individual cards with file name, date, status, and issue count
- Batch uploads appear as collapsible cards showing all files in the batch
- Click any upload to view its full analysis dashboard
- Chat-sourced uploads (from the live chatbot) are also listed here for all analysts
Next Steps
- Learn about each detection type: Hallucination, Bias, Toxicity
- Explore Analysis Modes to understand the trade-offs between Gemini, Groq, and Both
- Upload Ground Truth documents to improve analysis accuracy
- Try Batch Uploads for analyzing multiple files at once
- Set up Email Alerts to get notified when chat sessions complete